COURSE STRUCTURE
There are 10 lessons as follows:
1. Introduction
- Key terms and concepts: data, variables
- Measurements of scale: nominal, ordinal, interval,ratio
- Data presentation
- Probability
- Rounding of data
- Scientific notation
- Significant figures
- Functions
- Equations
- Inequalities
- Experimental design
- The normal curve
- Data collection
- Simple, systemic, stratified and cluster random sampling
- Remaining motivated to learn statistics
2. Distributions
- Scope and nature of distributions
- Class intervals and limits
- Class boundaries
- Frequency Distribution
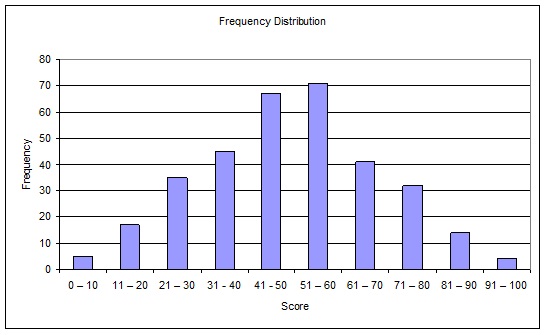
- Histograms
- Frequency polygons
- Normal distributions
- Other distributions
- Frequency curves
3. Measures of central tendency
- Range, percentiles, quartiles, mode, median, mean
- Variance
- Standard deviation
- Degrees of freedom
- Interquartile and semi interquartile deviations
4. The Normal curve and Percentiles and Standard Scores
- Normal distribution characteristics
- Percentiles
- Standard scores
- Z scores
- T score
- Converting standard scores to percentiles
- Area under a curve
- Tables of normal distribution
5. Correlation
- Scope and nature of Correlation
- Correlation coefficient
- Coefficient of determination
- Scatter plots
- Product movement for linear correlation coefficient
- Rank correlation
- Multiple correlation
6 Regression
- Calculating regression equation with correlation coefficient
- Least squares method
- Standard error of the estimate
7. Inferential Statistics
- Hypothesis testing
- Test for a mean
- Errors in accepting or rejecting null hypothesis
- Levels of significance
- One and two tailed tests
- Sampling theory
- Confidence intervals
8. The t Test
- Assessing statistical difference with the t test
- t Test for independent samples
- t Test for dependant (paired) samples
9. Analysis of variance
- Scope and application of ANOVA
- Factors and levels
- Hypothesis
- Calculate degrees of freedom
- Calculate sum of squares within and between groups
- Calculate mean square
- Calculate F
10. Chi square test
- Chi square goodness of fit test
- Calculate degrees of freedom
- Chi square test of independence
- Calculate expected frequencies
- Degrees of freedom
- Contingency tables
- Find expected frequencies
- Calculate degrees of freedom
Each lesson culminates in an assignment which is submitted to the school, marked by the school's tutors and returned to you with any relevant suggestions, comments, and if necessary, extra reading.
WHAT THE COURSE COVERS
Here are just some of the things you will be doing:
- To familiarise the student with different statistical terms and the elementary representation of statistical data.
- To familiarize the student with distributions, and the application of distributions in processing data.
- To apply measures of central tendency in solving research questions
- Demonstrate and explain the normal curve, percentiles and standard scores.
- To understand the methods of correlation that describes the relationship between two variables.
- To make predictions, with regression equations and determine how much error to expect, when making the predictions.
- To understand the basic concepts of underlying the use of statistics to make inferences.
- To examine the difference between the means of two groups with the t Test.
- Understand the use of ANOVA (Analysis of Variance) in analysing the difference between two or more groups.
- To introduce and apply the concept of Non Parametric Statistics.

LEARNING FACILITIES AT ACS
ACS follows the old fashioned idea that “the student comes first”. Our staff are told to treat every student as an individual and respond promptly to their enquiries; and the facilities we have developed and continue to develop, are all focused on that goal. Facilities include:
- Offices in two time zones (UK and Australia) –which means an international team of academics are responding to students 5 days a week and 16 hours a day.
- An online student room with unique resources that are only available to students studying our courses, including online library.
- Bookshop offering quality downloadable e books
- A data base of 20 million words of unique information written by our staff over 3 decades that can be drawn upon if needed by academics for use in supporting our students.
- Systems that ensure assignments are tracked, marked and returned to students, fast -commonly within a round 1 week & rarely more than 2 weeks (note: many other colleges take longer).
- The school is active in social networking and encourages students to connect with us and each other.
- No automated handling of student phone enquiries. When you call you get a real person; or leave a message and a real person will call you back within a day, but more commonly within an hour or two.
- No additional charges for extra tutor support over the phone or email.
- Free careers advice for graduates –It is our policy to provide support and advice to our students even after they graduate. If a graduate needs help with getting a CV together, or advice on setting up a business or looking for work; they only need ask.
- The quality of academic staff is higher than many other colleges.
WHAT NEXT?
Register to Study - Go to “It’s Easy to Enrol” box at the top of the page and you can enrol now.
or
Get Advice – Email us at info@acsedu.co.uk OR
Use our FREE COUNSELLING SERVICE to contact a tutor
CLICK TO CONTACT US